
Weather Visualization
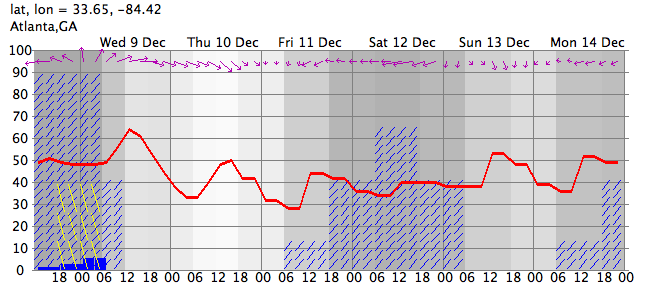
PlotWeather
PlotWeather displays U.S. National Weather Service forecasts in a 7-day graphic plot.
PlotClimate
PlotClimate generates graphics to visualize climate data for a particular location. This example plots solar radiation (sunlight intensity) recorded for the year 2006 in Seattle, WA, USA. Day of the year runs horizontally, hour of day vertically. The brightness of each pixel indicates the intensity of sunlight. Dark vertical bands show cloudy days of the year.